Actual order with your choice
Global ranking of risk factors by total number of deaths, 2019
weighing machine icon
High systolic blood pressure
10.8
Million
weighing machine icon
Smoking
7.7
Millions
weighing machine icon
Air pollution
6.7
Millions
weighing machine icon
High fasting plasma glucose
6.6
Millions
weighing machine icon
High body mass index
5.0
Millions

Source: State of global air, 202017

Table 2: WHO recommended air quality guidelines
Pollutant Averaging Time 2005 AQGs 2021 AQGs
PM2.5 Annual 10 5
24-hour 25 15
PM10 Annual 20 15
24-hour 50 45
Ozone (O3) Peak Season - 60
8-hour 100 100
Nitrogen oxide Annual 40 10
24-hour - 25
Sulphur dioxide 24-hour 20 40
Carbon Monoxide 24-hour - 4

Source: IQAir29

* New averaging time for 2021 | + Peak season - average of daily maximum 8-hour mean ozone concentration during the six consecutive months with the highest six-month running-average of ozone concentration NO2 1-hour average, SO2 10 minute average, and CO2 8-hour, 1-hour, and 15-minute averages unchanged from previous recommendations. Source: World Health Organization

Chart 11: Investments in energy infrastructure,
renewables vs conventional, % share, Asia
100%
75%
50%
25%
0%
2015
2016
2017
2018
2019
Renewables
Conventional Power

Source: IJGlobal, 2019137

Asia in Focus:

Clean Air and
the business
and human
rights agenda

Asia in Focus:

Clean Air and
the business
and human
rights agenda

speedometer icon Current mitigation measures

Governments in the Asia-Pacific region are adopting and implementing policies that are reducing pollution levels and will likely continue to do so in future. Without these policy interventions, population-weighted exposure to harmful particulate matter was expected to grow by more than 50% by 2030, based on the region’s projected 80% economic growth.102

pollution in asia images pollution in asia images pollution in asia images

Air pollution mitigation strategies adopted across Asia can be broadly divided into the following categories: vehicular emission standards, energy policies, air quality monitoring and transboundary haze.

Regional measures

The table below describes the regional agreements in place to address transboundary haze.

ASEAN Agreement on Transboundary Haze Pollution (AATHP), 2002

Signed in 2002 and enforced in 2003, the AATHP was the first regional agreement that brought together a group of contiguous States to tackle transboundary haze pollution emanating from land and forest fires.

ASEAN countries pollution image

Signed in 2003, the APMI was established to provide a framework for regional cooperation and to discuss measures related to capacity building and fire prevention. The key output of the APMI was a regional strategy for peatland management, the APMS.

APMS fire prevention image

The APMS was adopted in 2013 and focuses on the following objectives:103

Enhancing awareness and knowledge of peatlands

Addressing transboundary haze pollution and environmental degradation

Promoting sustainable management of peatlands

Enhancing and promoting collective regional cooperation on peatland issues.

According to some advocates, the ASEAN Agreement on Transboundary Haze Pollution has not yet achieved the desired result of reducing transboundary haze. This is primarily because the agreement lacks the power to penalise countries for non-compliance. Day-to-day management of the environmental agenda remains the responsibility of each ASEAN Member State. In this respect, there is something to learn from the enforceable protocols of the Long-Range Transboundary Air-Pollution (LRTAP) treaty signed in 1979 by 32 European countries. The LRTAP resulted in a successful reduction in concentrations of particulate matter through active engagement between scientists and policymakers.

 Transboundary Haze Pollution image

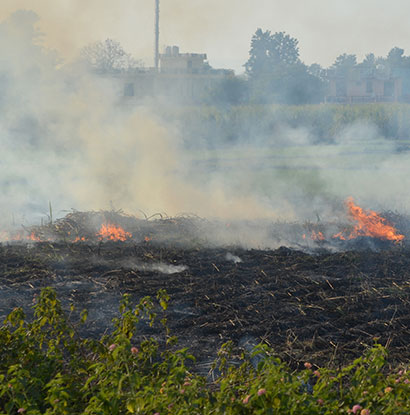
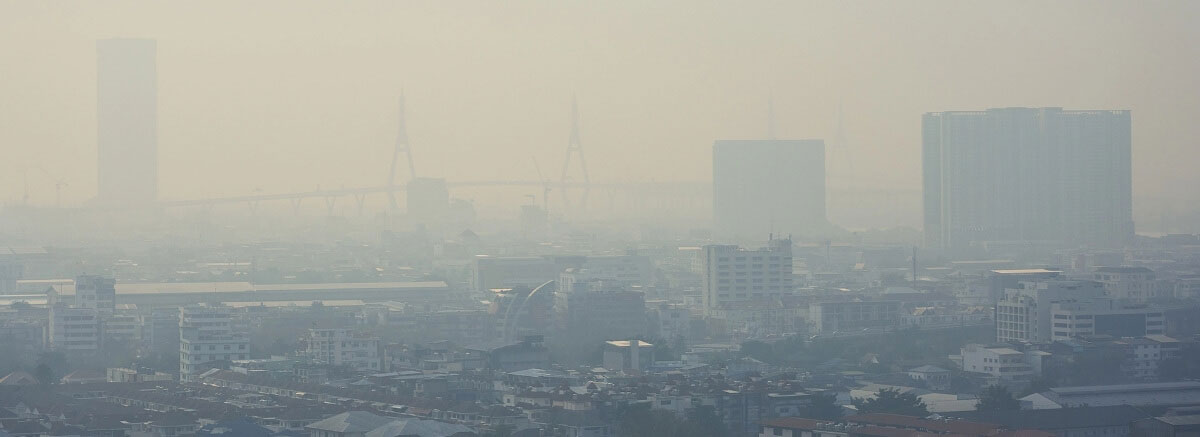
Transboundary air pollution in South-East Asia104

The ASEAN Agreement on Transboundary Haze Pollution (AATHP) was signed in 2002 and ratified by six members, Brunei, Malaysia, Myanmar, Singapore, Thailand and Vietnam. Indonesia ratified the agreement in 2015.

A wildfire, forest fire, bushfire, wildland fire image

Transboundary haze pollution is a recurring event in South-East Asia, mainly caused by the use of fires to clear vegetation for growing agricultural or cash crops such as corn, and palm oil, rubber or pulpwood. In the absence of legal restrictions in some South-East Asian countries, fires have become a cheap and convenient way to clear forests or agricultural land. This large-scale burning causes major episodes of transboundary haze that travels across borders and into neighbouring countries.

The Association of South-East Asian Nations (ASEAN) has been working to address the issue of transboundary haze pollution since 1995 when it established the Haze Technical Task Force.

The ASEAN Agreement on Transboundary Haze Pollution (AATHP) was signed in 2002 and ratified by six members, Brunei, Malaysia, Myanmar, Singapore, Thailand and Vietnam. Indonesia ratified the agreement in 2015.

The AATHP has several institutional provisions to support actions around managing haze pollution emanating from land/forest fires in the region. However, despite the existence of this legal framework, much remains to be done by member countries as severe haze events have continued in the region over the past decade.

Polluted City Image

According to Greenpeace South-East Asia, the AATHP has not been effective.105 A key shortcoming of the agreement is the lack of a provision for penalties for non-compliance with the stipulated obligations. Despite almost annual occurrences of haze, regional governments have only raised concerns surrounding the lack of action in originating countries.

Country-level measures

The table below summarises key mitigation measures that have been implemented to control air pollution in select Asian countries.

Focus country

Indonesia

Indonesia Indonesia Flag

Measure

In 2017, the government required that all gasoline-fuelled vehicles adopt Euro-4 fuel standards by September 2018.106

The Peatland Restoration Agency (BRG) was established in 2016 after a markedly severe haze season in 2015 with the aim of restoring over 2.6 million hectares of forest and peatlands devastated by the 2015 fires.107

Presidential Regulation No. 5/2006 concerning National Energy Policy sets the energy mix target for 2025, calling for a reduction of fossil oil from 52% in 2003 to 26.2% in 2025.108

From 2016 to 2020, Indonesia’s public real-time air quality monitoring network grew from a few monitors in Jakarta to 77 stations across 19 cities.109

Thiland Thailand Flag

Measure

The UNEP is collaborating with the Pollution Control Department (PCD) to leapfrog from Euro-4 vehicle emission standards to Euro-6.110

The PCD coordinates with provincial governments to help them during times of peak pollution. For example, it is helping to find solutions to open burning by developing an air quality forecasting tool that could help to identify the appropriate weather conditions for burning to occur.111

From 2017 to 2020, Thailand’s public air quality monitoring network grew from 54 to 565 stations. While the Thai government provides the region’s largest monitoring network, non-governmental contributors operate 73% of monitoring stations nationally.112

Bangkok plans to amend regulations to allow access to electricity chargers at petrol stations. The excise tax on electric vehicle components has been decreased by 10% as part of a plan to promote electric vehicles in Thailand.113

Vietnam Vietnam Flag

Measure

On June 1, 2016, the prime minister approved a national action plan on air quality management.

Vietnam’s air quality monitoring network more than doubled between 2019 and 2020, growing from 54 monitoring stations across four cities to 118 stations across 24 cities.114

In 2019, Can Tho became the first Vietnamese city to join the worldwide BreatheLife Network, committing to reaching WHO air quality guidelines for PM2.5 and other pollutants by 2030. With this commitment, Vietnam’s fourth-largest city set an air quality control precedent for other Vietnamese cities to follow.115

On April 13, 2022, the prime minister approved the National environmental protection strategy, which includes air quality control standards, targets and timelines.

India Indian Flag

Measure

In April 2020, the Euro-6 standards came into effect throughout India for all light and heavy-duty vehicles, as well as two- and three-wheeled vehicles.116

The Pradhan Mantri Ujjwala Yojana (PMUY) scheme resulted in an increase in national LPG coverage from 61.9% as of April 1, 2016, to 99.5% as of January 1, 2021, and provided 50 million LPG connections to households with incomes below the poverty line.117

The Graded Response Action Plan (GRAP) was adopted in Delhi to tackle pollution control in the National Capital Territory. Polluters are reportedly facing increasing levels of accountability.118

The National Clean Air Programme (NCAP) is India’s flagship scheme for improving air quality. From a 2017 baseline, the NCAP targets PM2.5 reductions of 20-30% in 122 selected cities by 2024.119

Mongolia Mongolia Flag

Measure

Air quality monitoring in Mongolia is growing rapidly, largely due to non-governmental organisations and individuals whose community-deployed sensors now supply two-thirds of the national data. There is a high concentration of stations in Ulaanbaatar, which, with 40 stations, has quickly become one of the most densely monitored cities globally.120

In May 2019, the government implemented a ban on the burning of raw coal. This has led to a 46% reduction in emissions since implementation.121

Mongolia’s excise tax favours electric and hybrid vehicles.

Malaysia Malaysia Flag

Measure

The Ministry of Environment and Water (KASA) has made a strong push for a greener economy in its Strategic Plan 2020-2030: Environmental Sustainability in Malaysia, with improving air quality being among the top ten national priorities.122

Malaysia has made progress in tackling local sources of burning through increased governmental cooperation and a well-developed air quality monitoring network.123

Philippines Philippines Flag

Measure

The proposed National Renewable Energy Programme (NREP) 2020-2040 set targets of 35% renewable energy in the power generation mix by 2030, and 50% by 2040.124

The Philippines Department of Transportation launched the Public Utility Vehicle (PUV) Modernisation Programme in 2017 with the objective of a comprehensive modernisation of public road vehicles in the Philippines, including jeepneys and buses.125

The road-sharing movement "Bayanihan sa Daan" seeks to set aside half of the road for non-motorised transportation, safe and covered sidewalks and all-weather bike lanes while reserving the other half for an organised transport system.126

Sri Lanka Sri-Lanka Flag

Measure

The purported aim of Sri Lanka’s Clean Air 2025 action plan is to reduce urban, industrial and indoor air pollution and maintain air quality at desirable levels by minimising the emission of harmful air pollutants.127

Sri Lanka has taken steps to reduce transport-related pollution, including the phasing out of leaded gasoline in June 2002, the introduction of low-sulphur diesel in January 2003, the banning of two-stroke three-wheeled imports in 2008, and the launch of a vehicular emissions testing programme in 2008.128

Bangladesh Bangladesh Flag

Measure

The government's 8th Five Year Plan (July 2020 – June 2025) places significant emphasis on addressing urban air pollution through proposed targets for the reduction of particulate matter levels, taxes on polluting industries and mechanisms for data storage and monitoring.129

The Brick Manufacturing and Kiln Installation Act 2013 prohibited the building of brick kilns in residential, preserved or commercial areas. The act was amended in 2019 to make mandatory use of block bricks and introduced phased targets to reduce the use of clay-fired bricks over 2019-2025.130

By some measures, China’s efforts to stem the impact of air pollution sets an important standard to inform mitigation measures taken elsewhere in the region. In 2014, the Chinese government declared a ‘war on pollution’, implementing a number of stringent measures to regulate fine particulate matter (PM2.5) emissions. Between 2014 and 2019, Beijing witnessed a 21% decline in the concentration of particulate matter, while Shanghai witnessed a 31% decline. Though there is more to be done, the measures adopted by the Chinese government set a new standard of commitment and action in the region.

China’s war on air pollution

A timeline charting the Chinese government’s efforts to improve air quality:

2013

2013: Government launches the Air Pollution Prevention and Control Action Plan

This five-year plan set the following targets to be achieved by 2017:131

Reduce total PM2.5 concentration levels by at least 10% (compared with 2012 levels) in all areas except the following three clusters, where higher reduction targets apply: Beijing-Tianjin-Hebei (25%); Yangtze River Delta (20%) and Pearl River Delta (15%)

Implement fuel standards for gasoline and diesel, mandating sulphur content to be less than 10 micrograms per gram

Decommission 15 million polluting motor vehicles

Ensure new or upgraded public buses in Beijing, Shanghai and Guangzhou are non-fossil fuelled

Reduce the share of coal in the country’s energy mix from 68% to 65%

Accelerate the monitoring and disclosing of PM2.5 readings across all cities

2014: Government declares a ‘war on pollution’—including air pollution.

The government introduced several stringent measures and regulatory changes to tackle the challenge of air pollution. These included:

Recognising PM2.5 as a primary pollutant and establishing national maximum limits

Initiating a national level, real-time air quality monitoring and disclosure programme

Executing environmental policies that included pilot carbon cap-and-trade programmes and electrification of the passenger transportation system

Expanding the number of air quality monitoring stations across the country

Placing restrictions on the number of on-road vehicles

Replacing coal-fired power plants with natural gas plants132

2018: Government launches Three-year Action Plan for Winning the Blue Sky War133

The Three-year Action Plan for Winning the Blue Sky War expanded the number of cities under coverage (compared with the Air Pollution Control Action Plan 2013-2017) and set the following key targets to be achieved by 2020:

Reduce PM2.5 concentration levels by at least 18% (compared with 2015 levels) in cities where previous targets have not been met

Reduce volatile organic compound (VOC) emissions by 10% and nitrogen oxide emissions by 15% to control ozone pollution

Reduce pollutant emissions ‘in conjunction with’ a reduction in greenhouse gas emissions

2021: Government launches its latest five-year plan (2021-2025)134
This plan outlines various pollution-oriented goals:

Sets a target of ‘basically eliminating’ heavy air pollution days by 2025

Major push for clean energy, with a target of 20% non-fossil energy in total energy consumption, and a target to reduce the CO2 emissions per unit of GDP by 18% between 2020 and 2025

Coal consumption capped at 4.2 billion tonnes in 2025—close to the current consumption levels

A nuclear power capacity target of 70GW in 2025, up from 52GW currently

2021: Government launches Human Rights Action Plan of China (2021-2025)135

Under this plan, further action will be taken to:

Prevent and control atmospheric pollution and coordinate the government’s commitments to reducing air pollutants and greenhouse gas emissions

Improve the eco-environmental legal system, strengthen government information releases and improve law-based disclosure of corporate information

Formulate and enforce environmental impact evaluation law and implement measures to facilitate public participation in environmental impact evaluation

Encourage and expand the scope of public-interest environmental litigation

Adopt a holistic approach to eco-environmental restoration and protection

Source: Energy Policy Institute, University of Chicago (2018), The Air Quality Life Index.136

Speeding up the energy transition for better air quality

Business enterprises involved in thermal energy production are among the largest direct contributors to air pollution. The burning of coal for energy is a leading cause of both climate change and air pollution and of the world’s three largest coal-consuming countries, two are found in Asia. By transitioning away from fossil-fuel-powered energy to renewable energy sources, businesses can reduce their contribution to air pollution and address human rights abuses that arise as a direct result of their operations. The State can facilitate the acceleration of this transition by incentivising investments in renewable energy projects and by holding energy firms accountable for adverse impacts on the right to a clean, healthy and sustainable environment.

The transition from conventional power to renewables can help to significantly reduce air pollution from energy generation in Asia.

By transitioning away from fossil-fuel-powered energy to renewable energy sources, businesses can reduce their contribution to air pollution and address human rights abuses that arise as a direct result of their operations. The State can facilitate the acceleration of this transition by incentivising investments in renewable energy projects and by holding energy firms accountable for adverse impacts on the right to a clean, healthy and sustainable environment.

Investments in energy infrastructure,
renewables vs conventional, % share, Asia

Drag the year slider to compare

Renewables
Conventional Power
0%
25%
50%
75%
100%
2015
2016
2017
2018
2019

Source: IJGlobal, 2019137

Chart 11: Investments in energy infrastructure, renewables vs conventional, % share, Asia
100%
75%
50%
25%
0%
2015
2016
2017
2018
2019
Renewables
Conventional Power

Source: IJGlobal, 2019137

Source: Bloomberg League Tables, 2021138

There is growing evidence of increased interest from private investment firms in financing renewable sector projects. Since the signing of the Paris Agreement in 2015, bank lending to the green sector, which includes renewable energy, among other climate-friendly ventures, has more than quadrupled—from US$68bn in 2015 to US$323bn in 2020. By contrast, investments in fossil fuels—oil, gas and coal-related investments—have been on a downward trend since 2018.

Another important trend involves private sector players stepping in as corporate purchasers of renewable energy. Traditionally, the key purchasers for most energy projects are State-owned energy utilities. However, today multinational companies are signing corporate power purchase agreements (corporate PPAs) to purchase power directly from renewable energy producers in a bid to reduce their carbon footprint.

60MW

In 2018, Microsoft signed a corporate PPA with the Sunseap Group in Singapore to purchase 100% of the electricity generated by its 60MW solar rooftop portfolio.

While this trend has been prevalent in the Americas and Europe, Middle East and Africa regions since 2013, corporate energy purchasing is now gaining pace in the Asia-Pacific region. For example, in January 2019, Google signed a long-term corporate PPA (>10 years) where it agreed to purchase electricity from a 10MW solar farm in Tainan City for its Changhua data centre. In 2018, Microsoft signed a corporate PPA with the Sunseap Group in Singapore to purchase 100% of the electricity generated by its 60MW solar rooftop portfolio. Through 2018 and 2019, Australia has witnessed a number of corporations, such as Telstra, Kellogg and Coca-Cola Amatil, signing up to purchase wind and solar power.

While these steps were primarily implemented to reduce their carbon footprint, the move to renewable energy can drive down demand for electricity derived from air-polluting coal.139

Emissions trading scheme for particulate matter – Surat, India

The pilot scheme started operating in September 2019. It aims to reduce particulate emissions by 29%.

textile manufacturing industry image

Surat, an industrial city in India known for its vibrant textile manufacturing industry, witnessed the launch of a global first in controlling air pollution: an emissions trading scheme for particulate matter. The scheme was implemented by the Gujarat Pollution Control Board in coordination with researchers from the University of Chicago, Yale University and the Abdul Latif Jameel Poverty Action Lab (J-PAL).

The emissions ceiling set by the Emissions Trading Scheme (ETS) is equal to the amount of air pollution that would have been released if all industrial units had complied with the norm of 280 tonnes per month.140 Hence, the ETS monthly cap was set at 280 tonnes per industrial unit. Participating units can comply by either cutting their particulate matter emissions using appropriate technology or by purchasing emission permits to emit more than the government-specified limit. Units with surplus permits can sell excess permits to more polluting units for whom it is more expensive to install pollution-reducing technology.141 Existing pollution control measures involve installing bag filters and cyclone equipment to comply with pollution norms. Under the ETS, the average cost of reducing 1kg of particulate pollution was found to be less than the cost of installing the pollution control equipment.142

Infinity image

The scheme is projected to foster economic growth by reducing compliance costs for industries and improving people’s health by reducing particulate air pollution. Preliminary results indicate that pollution emissions witnessed a 24% decline among participating factories compared with the control units.143

Leveraging trade policy to mitigate air pollution

Another potentially powerful tool States can leverage to mitigate air pollution is trade policy. Trade policy is an engine for inclusive economic growth and poverty reduction, but trade expansion can also lead to higher levels of pollution, particularly in countries with less stringent environmental policies. By contrast, research suggests that when preferential trade agreements (PTAs) include environmental provisions, they can promote domestic environmental legislation, which leads to a reduction in air pollution and emissions.144

textile manufacturing industry image

Source: UNDP Sri Lanka

India's climateSMART city mission – measuring air quality

The inclusion of air- and climate-relevant parameters place green measures at the heart of the Smart City framework, an indicator of the government’s commitment to improving air quality as cities develop and grow.

The inclusion of air quality as an indicator in India's climateSMART Cities Assessment Framework145 aims to embed a green mindset in cities. The framework has five main pillars and a total of 28 indicators. ‘Mobility and air quality’ is a standalone pillar with five indicators that measure existing air pollution levels and clean air action plans.

The five indicators under the pillar of ‘Mobility and air quality' are:146

Mobility and air quality image

Clean Air Action Plan (Planning and Implementation)

Level of air pollution

Non-motorised transport network coverage (pedestrian and bicycle)

Availability of public transport

Clean technology-shared vehicles

The framework currently applies to 100 cities included in the Smart City Mission.

"By mandating that all smart cities monitor air quality and have a clean air action plan in place, it works very well for cities as it directly focuses on mitigation."

- Prarthana Borah, Director, CDP India


transparent

References

X

1 https://www.ccacoalition.org/en/content/air-pollution-measures-asia-and-pacific

2 https://e360.yale.edu/digest/air-pollution-from-fossil-fuels-costs-8-billion-per-day-new-research-finds

3 For the full list of UNGPs, see > https://www.ohchr.org/sites/default/files/documents/publications/guidingprinciplesbusinesshr_en.pdf

4 https://timesofindia.indiatimes.com/india/india-third-most-polluted-country-delhi-most-polluted-capital-report/articleshow/81537532

5 Greenpeace Southeast Asia and Centre for Research on Energy and Clean Air

6 https://www.ncbi.nlm.nih.gov/pmc/articles/PMC6923778/#B3

7 https://www.newyorker.com/news/dispatch/the-coronavirus-offers-a-radical-new-vision-for-indias-cities-pollution

8 https://twitter.com/hp_tourism/status/1246017228274728960

9 https://www.ndtv.com/cities/jalandhar-sees-dhauladhar-range-for-first-time-in-decades-amid-lockdown-2205943

10 https://www.who.int/news/item/04-04-2022-billions-of-people-still-breathe-unhealthy-air-new-who-data

11 https://www.ccacoalition.org/en/content/air-pollution-measures-asia-and-pacific

12 https://timesofindia.indiatimes.com/india/india-third-most-polluted-country-delhi-most-polluted-capital-report/articleshow/81537532
world-air-quality-report-2020-en-pdf
(2020 Report-English - page 4, section on Executive summary) More recent data is available from the same source but was released after the report went into production.

13 US AQI >100 https://www.airnow.gov/aqi/aqi-basics/#:~:text=Think%20of%20the%20AQI%20as,300%20represents%20hazardous%20air%20quality
world-air-quality-report-2020-en-pdf
(2020 Report-English - page 4, section on Executive summary) More recent data is available from the same source but was released after the report went into production.

14 https://timesofindia.indiatimes.com/india/india-third-most-polluted-country-delhi-most-polluted-capital-report/articleshow/81537532<
world-air-quality-report-2020-en-pdf
(2020 Report-English - page 4, section on Executive summary) More recent data is available from the same source but was released after the report went into production.

15 https://aqli.epic.uchicago.edu/pollution-facts/

16 https://pubmed.ncbi.nlm.nih.gov/33735795/

17 https://www.stateofglobalair.org/

18 https://www.iarc.who.int/wp-content/uploads/2018/07/pr221_E.pdf

19 https://www.economist.com/asia/2021/11/06/indias-toxic-air-is-its-most-immediate-environmental-problem

20 https://ourworldindata.org/air-pollution#air-pollution-is-one-of-the-world-s-leading-risk-factors-for-death

21 https://ourworldindata.org/air-pollution#air-pollution-is-one-of-the-world-s-leading-risk-factors-for-death

22 https://ourworldindata.org/outdoor-air-pollution

23 https://www.who.int/news/item/22-09-2021-new-who-global-air-quality-guidelines-aim-to-save-millions-of-lives-from-air-pollution

24 https://www.who.int/news/item/22-09-2021-new-who-global-air-quality-guidelines-aim-to-save-millions-of-lives-from-air-pollution#:~:text=At%20the%20same%20time%2C%20 however,more%20healthy%20years%20of%20life

25 https://energyandcleanair.org/publications/costs-of-air-pollution-from-fossil-fuels/

26 https://www.ccacoalition.org/en/content/air-pollution-measures-asia-and-pacific

27 https://www.who.int/news-room/fact-sheets/detail/ambient-(outdoor)-air-quality-and-health

28 https://www.who.int/news-room/fact-sheets/detail/ambient-(outdoor)-air-quality-and-health

29 "Air quality guidelines (AQGs) released by the WHO provide recommendations on air quality levels as well as interim targets for six key air pollutants. These are based on the extensive scientific evidence currently available; the guidelines identify the levels of air quality necessary to protect public health worldwide. The AQGs also serve as a reference for assessing if, and by how much, the exposure of a population exceeds levels at which it might cause health concerns. They cover some of the most monitored pollutants critical for health, for which evidence on health effects from exposure has advanced the most in the past 15 years.” https://www.who.int/news-room/questions-and-answers/item/who-global-air-quality-guidelines

30 https://www.iqair.com/blog/air-quality/2021a-WHO-air-quality-guidelines

31 https://www.sciencedirect.com/science/article/pii/S1352231015303320#appsec1

32 https://www.sciencedirect.com/science/article/pii/S0048969720336111

33 https://www.sciencedirect.com/science/article/pii/S0048969720336111

34 https://www.ncbi.nlm.nih.gov/pmc/articles/PMC6923778/

35 https://www.ncbi.nlm.nih.gov/pmc/articles/PMC6923778/#B3

36 https://undocs.org/A/HRC/RES/48/13

37 United Nations, General Assembly, The human right to a clean, healthy and sustainable environment, A/76/L.75 (26 July 2022)

38 https://documents-dds-ny.un.org/doc/UNDOC/GEN/G20/202/42/PDF/G2020242.pdf?OpenElement

39 Interview insight - Dr Surya Deva

40 https://undocs.org/en/A/RES/64/292

41 https://news.un.org/en/story/2021/10/1103082

42 https://www.ohchr.org/en/NewsEvents/Pages/DisplayNews.aspx?NewsID=26116&LangID=E#_ftnref2

43 https://www.ohchr.org/en/statements/2020/07/10th-anniversary-recognition-water-and-sanitation-human-right-general-assembly?LangID=E&NewsID=26116

44 https://ideas4development.org/en/right-water-fundamental-human-right/

45 https://www.ohchr.org/en/statements/2020/07/10th-anniversary-recognition-water-and-sanitation-human-right-general-assembly?LangID=E&NewsID=26116#_ftn1

46 https://shiftproject.org/wp-content/uploads/2012/11/How-to-use-the-UN-Guiding-Principles-on-Business-and-Human-Rights-in-company-research-and-advocacy.pdf

47 https://www.ohchr.org/documents/issues/business/a-hrc-17-31_aev.pdf

48 https://www.ohchr.org/documents/issues/business/a-hrc-17-31_aev.pdf

49 https://www.adb.org/sites/default/files/publication/659631/climate-litigation-asia-pacific.pdf

50 https://www.globalhealthrights.org/henares-and-ors-v-land-transportation-franchising-and-regulatory-board-and-ors/

51 https://documents1.worldbank.org/curated/en/685751588227715919/pdf/Dirty-Stacks-High-Stakes-An-Overview-of-Brick-Sector-in-South-Asia.pdf

52 https://documents1.worldbank.org/curated/en/685751588227715919/pdf/Dirty-Stacks-High-Stakes-An-Overview-of-Brick-Sector-in-South-Asia.pdf

53 https://discovery.ucl.ac.uk/id/eprint/894/1/Millennium_rvw_final_october.pdf

54 https://tcc-gsr.com/wp-content/uploads/2021/06/1.3-Asia-Regional-Overview.pdf

55 Calculations by Economist Impact, based on data from https://data.adb.org/dataset/asian-transport-outlook-database (See Asia Transport Outlook Database – Excel file name > ‘National air pollution and health’, Sheet name> ‘APH-VAP-031’

56 https://www.channelnewsasia.com/world/explainer-power-impact-climate-change-1339031

57 https://www.economist.com/leaders/2019/08/22/asian-governments-are-the-biggest-backers-of-the-filthiest-fuel

58 https://www.stateofglobalair.org/data/#/air/plot

59 https://www.stateofglobalair.org/data/#/air/plot

60 https://e360.yale.edu/digest/air-pollution-from-fossil-fuels-costs-8-billion-per-day-new-research-finds

61 https://blogs.adb.org/blog/crystal-clear-asia-s-cities-are-finding-innovative-ways-clean-their-skies

62 Figures are estimates from modelling exercises. Scientific studies that use computer models do not give results with absolute certainty. Instead a range is provided (known as an 'interval'). The ‘confidence range’ is the range that is most likely to contain the true value. A 95% confidence interval means that with 95% probability, reality is somewhere inside the confidence interval, and a 5% chance it is outside the interval (either higher or lower than the range of numbers in the range). The value with the highest probability to be the true value is called the central estimate. It is somewhere inside the confidence interval. The bounds of the confidence interval are called the low and the high estimate.

63 https://www.greenpeace.org/static/planet4-southeastasia-stateless/2020/02/29e450ab-data-driven-media-briefing-110220.pdf

64 These figures are central estimates. See footnote 60 for a definition of central estimates.

65 https://www.greenpeace.org/static/planet4-southeastasia-stateless/2020/02/21b480fa-toxic-air-report-110220.pdf

66 https://www.unescap.org/sites/default/files/The%20Economics%20of%20Climate%20Change%20%20in%20the%20Asia-Pacific%20region.pdf (Section on Highlights, page v)

67 https://mitsloan.mit.edu/ideas-made-to-matter/psychological-economic-and-social-costs-air-pollution

68 https://mitsloan.mit.edu/ideas-made-to-matter/psychological-economic-and-social-costs-air-pollution

69 https://www.who.int/publications/i/item/air-pollution-and-child-health#:~:text=Globally%2C%2093%25%20of%20all%20children,indirectly%20related%20to%20environmental%20risks

70 https://www.unep.org/news-and-stories/story/why-legislation-needed-curb-air-pollution

71 https://www.unep.org/news-and-stories/story/five-reasons-you-should-care-about-air-pollution

72 https://bmcpublichealth.biomedcentral.com/articles/10.1186/s12889-018-6025-1

73 https://www.stateofglobalair.org/health/global#Millions-deaths

74 https://aqli.epic.uchicago.edu/the-index/

75 https://aqli.epic.uchicago.edu/the-index/

76 https://dalberg.com/our-ideas/more-than-a-public-health-crisis-air-pollutions-impact-on-the-indian-economy/

77 https://dalberg.com/our-ideas/more-than-a-public-health-crisis-air-pollutions-impact-on-the-indian-economy/

78 https://insights.som.yale.edu/insights/skilled-workers-flee-from-polluted-cities-hampering-economic-growth

79 Ground level ozone is a pollutant formed as a result of chemical reactions between oxides of nitrogen and volatile organic compounds in the presence of sunlight. These chemicals are emitted from industrial plants, electric utilities, vehicle exhaust etc.

80 https://www.asianscientist.com/2022/01/in-the-lab/ozone-emission-exposure-pollution-crop-loss/#:~:text=Ozone%20pollution%20has%20been%20linked,maize%20 yield%20in%20East%20Asia

81 https://www.sei.org/featured/5-ways-reducing-pollution-can-improve-equality-for-women/

82 https://www.ft.com/content/ee08d61d-4c98-4398-9971-93036d67e91e

83 https://impact.economist.com/perspectives/sites/default/files/resettingtheagenda.pdf

84 https://theprint.in/environment/how-air-pollution-has-become-a-big-factor-in-indians-decision-to-work-in-delhi/316489/

85 https://theprint.in/environment/how-air-pollution-has-become-a-big-factor-in-indians-decision-to-work-in-delhi/316489/

86 https://insights.som.yale.edu/insights/skilled-workers-flee-from-polluted-cities-hampering-economic-growth

87 https://www.un.org/en/observances/biological-diversity-day

88 http://www.equilibriumconsultants.com/upload/document/airpollutionandbiodi4f9.pdf

89 https://www.ilo.org/asia/media-centre/news/WCMS_627585/lang--en/index.htm

90 https://www.rockefellerfoundation.org/wp-content/uploads/Health-Vulnerabilities-of-Informal-Workers.pdf

91 https://www.who.int/teams/environment-climate-change-and-health/air-quality-and-health/health-impacts

92 https://academic.oup.com/cardiovascres/article/116/14/2247/5940460

93 https://www.sciencedirect.com/science/article/pii/S0160412016305992

94 https://asiapacific.unfpa.org/en/news/rights-indigenous-peoples-must-be-protected-and-respected

95 https://www.worldbank.org/en/topic/indigenouspeoples#1

96 https://www.worldbank.org/en/topic/indigenouspeoples#1

97 https://airqualitynews.com/2022/03/22/97-of-global-cities-do-not-meet-latest-who-air-quality-guidelines/#:~:text=97%25%20of%20global%20cities%20and,The%20report%20analysed%20PM2

98 https://www.unep.org/news-and-stories/story/five-reasons-you-should-care-about-air-pollution

99 https://ourworldindata.org/grapher/pm25-exposure-gdp

100 Interview insight from Prarthana Borah

101 https://www.cleanairfund.org/wp-content/uploads/2021/09/The-State-of-Global-Air-Quality-Funding-2021-report-compressed-2.pdf

102 https://www.ccacoalition.org/en/content/air-pollution-measures-asia-and-pacific

103 https://cil.nus.edu.sg/wp-content/uploads/2020/05/2013-Updated-APMS-1.pdf

104 https://www.eria.org/ERIA-DP-2015-82.pdf

105 https://www.greenpeace.org/southeastasia/press/3239/a-haze-free-asean-by-2020-are-we-there-yet/

106 https://theicct.org/sites/default/files/publications/Indonesia-sootfree-CBA-02182020.pdf

107 https://www.science.org/content/article/indonesias-fires-are-bad-new-measures-prevented-them-becoming-worse

108 https://www.climate-laws.org/geographies/indonesia/policies/presidential-regulation-5-2006-concerning-national-energy-policy

109 https://www.iqair.com/world-most-polluted-cities/world-air-quality-report-2020-en.pdf

110 https://www.unep.org/news-and-stories/story/air-pollution-choking-bangkok-solution-reach

111 https://cdn.sei.org/wp-content/uploads/2021/02/210212c-killeen-archer-air-quality-in-thailand-wp-2101e-final.pdf

112 https://www.iqair.com/world-most-polluted-cities/world-air-quality-report-2020-en.pdf

113 https://www.mdpi.com/2032-6653/12/1/2/pdf

114 https://www.iqair.com/world-most-polluted-cities/world-air-quality-report-2020-en.pdf

114 https://www.who.int/vietnam/news/detail/12-12-2019-who-commends-can-tho-s-commitment-to-tackle-air-pollution#:~:text=HANOI%2C%2012%20December%202019%20%E2%80%93%20The,to%20safe%20levels%20by%202030

116 https://theicct.org/sites/default/files/publications/India%20BS%20VI%20Policy%20Update%20vF.pdf

117 https://www.pmuy.gov.in/about

118 https://indianexpress.com/article/explained/explained-what-is-grap-delhi-ncrs-action-plan-as-air-pollution-increases-6719746/

119 https://www.sciencedirect.com/science/article/pii/S2590162120300368

120 https://www.iqair.com/world-most-polluted-cities/world-air-quality-report-2020-en.pdf

121 https://www.npr.org/2019/07/30/727688757/mongolias-capital-banned-coal-to-fix-its-pollution-problem-will-it-work

122 https://www.kasa.gov.my/roadmap/Roadmap_KASA_2020-2030-en.pdf

123 https://wedocs.unep.org/bitstream/handle/20.500.11822/20247/SouthEastAsia_report.pdf?amp%3BisAllowed=&sequence=1

124 https://www.pna.gov.ph/articles/1159659

125 https://changing-transport.org/modernizing-public-transport-in-the-philippines/

126 https://www.officialgazette.gov.ph/2016/01/28/govt-supports-road-sharing/

127 https://rise.esmap.org/data/files/library/sri-lanka/Renewable%20Energy/RE%206.1%20Clean%20Air%202025%20Action%20plan.pdf

128 https://bmcpublichealth.biomedcentral.com/articles/10.1186/1471-2458-10-300

129 http://plancomm.gov.bd/sites/default/files/files/plancomm.portal.gov.bd/files/68e32f08_13b8_4192_ab9b_abd5a0a62a33/2021-02-03-17-04-ec95e78e452a813808a483b3b22e14a1.pdf

130 http://plancomm.gov.bd/sites/default/files/files/plancomm.portal.gov.bd/files/68e32f08_13b8_4192_ab9b_abd5a0a62a33/2021-02-03-17-04-ec95e78e452a813808a483b3b22e14a1.pdf

131 http://english.cbcsd.org.cn/SDtrends/20130922/73436.shtml#:~:text=on%20September%2010th-,The%20Airborne%20Pollution%20Prevention%20and%20Control%20Action%20Plan%20(2013%2D17,at%20the%20Environmental%20Protection%20Ministry

132 http://english.cbcsd.org.cn/SDtrends/20130922/73436.shtml#:~:text=on%20September%2010th-,The%20Airborne%20Pollution%20Prevention%20and%20Control%20Action%20Plan%20

133 https://www.loc.gov/item/global-legal-monitor/2018-08-16/china-2020-air-pollution-action-plan-released/

133 https://energyandcleanair.org/china-14th-five-year-plan-carbon-neutrality/

135 http://english.www.gov.cn/news/topnews/202109/09/content_WS6139a111c6d0df57f98dfeec.html

136 https://aqli.epic.uchicago.edu/country-spotlight/china/

137 https://www.ijglobal.com/

138 https://www.bloomberg.com/graphics/2021-wall-street-banks-ranked-green-projects-fossil-fuels/#xj4y7vzkg

139 https://www.aiib.org/en/news-events/asian-infrastructure-finance/2020/_common/pdf/AIIB_AIF2020_16April2020.pdf

140 https://epic.uchicago.in/wp-content/uploads/2019/10/ETS_INDIA_ResearchSummaryFinal-.pdf

141 https://www.business-standard.com/article/current-affairs/this-pilot-trading-scheme-in-surat-could-help-firms-reduce-air

142 https://epic.uchicago.in/wp-content/uploads/2019/10/ETS_INDIA_ResearchSummaryFinal-.pdf

143 https://epic.uchicago.edu/news/worlds-first-emissions-trading-scheme-for-particulate-pollution-starts-in-surat/

144 https://www.tandfonline.com/doi/abs/10.1080/09644016.2017.1338213?journalCode=fenp20

145 https://smartcities.gov.in/climatesmart_cities

146 https://www.niua.org/csc/assets/pdf/key-documents/phase-2/CSCAF-2.0-Brochure_24042020.pdf

147 For the full list of UNGPs, see > https://www.ohchr.org/sites/default/files/documents/publications/guidingprinciplesbusinesshr_en.pdf

148 https://oxfordre.com/environmentalscience/view/10.1093/acrefore/9780199389414.001.0001/acrefore-9780199389414-e-718

149 https://www.thai-german-cooperation.info/en_US/vehicle-pollution-fund-in-the-philippines-tackling-the-final-steps-towards-utilisation/

150 Garton, Kelly, Thow, Anne Marie & Swinburn, Boyd. (2020). International Trade and Investment Agreements as Barriers to Food Environment Regulation for Public Health Nutrition: A Realist Review. Journal of Health Policy and Management.

151 For the full list of UNGPs, see > https://www.ohchr.org/sites/default/files/documents/publications/guidingprinciplesbusinesshr_en.pdf

152 https://unfccc.int/sites/default/files/resource/Considerations%20regarding%20vulnerable.pdf

153 https://www.sei.org/featured/5-ways-reducing-pollution-can-improve-equality-for-women/

154 https://medium.com/pakistan-air-quality-initiative/introducing-the-pakistan-air-quality-initiative-%D9%BE%D8%A7%DA%A9%DB%8C-d1f2f9ed7d11

155 Not exhaustive