Asia in Focus:
Clean Air
and
the business
and human
rights agenda

Asia in Focus:
Clean Air
and
the business
and human
rights agenda


The role of industry
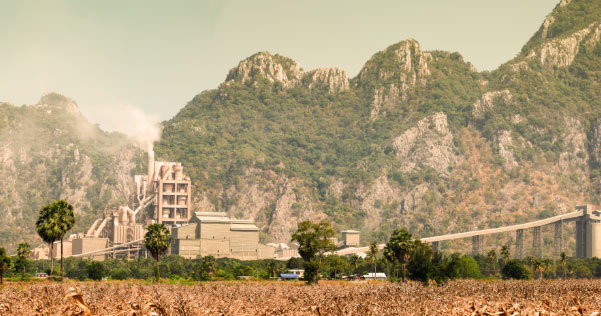
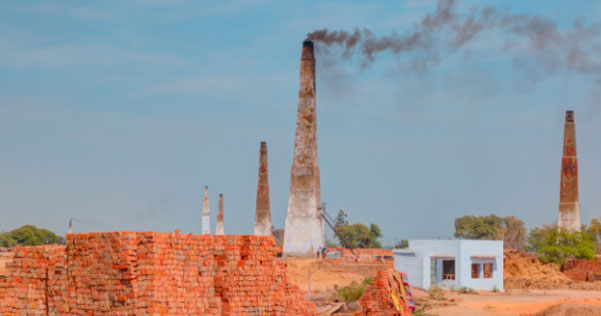
Industrial operations


Transport
Fossil-fuel-based electricity generation
Air pollution statistics
Select a country/region
2019
2015
2010
WHO limit = 5 µg/m3
(WHO 2021 air quality guideline for annual average PM2.5 exposure)
2019
2015
2010
WHO limit = 5 µg/m3
(WHO 2021 air quality guideline for annual average PM2.5 exposure)
Source: Health Effects Institute (2020), State of Global Air 2020. Special Report.58,59
Disclaimer: The designations employed and the presentation of material on this nap do not imply the expression of any opinion whatsoever on the part of the Secretariat of the United Nations or UNDP concerning the legal status of any country, territory, city or area or its authorities, or concerning the delimitation of its frontiers or boundaries
Costs of air pollution
Cost to the economy
| Pollutant | Impact | Central Estimate62 |
|---|---|---|
|
Nitrous Oxide |
Total cost to economy |
US$351 billion |
|
% GDP |
0.4% |
|
|
Ozone |
Total cost to economy |
US$351 billion |
|
% GDP |
0.4% |
|
|
PM2.5 |
Total cost to economy |
2.5% |
|
% GDP |
0.4% |
|
|
Work absences (days) |
1,755,200,000 |
|
|
Global cost of pollutants |
Total cost to economy |
US$2.9 trillion |
|
% GDP |
3.3% |
Public health costs of air pollution
Air pollution and poverty
Even in high-income economies, poorer neighbourhoods are often located near busy city highways or close to industrial areas. These locations have higher air pollution levels, increasing exposure to outdoor air pollution among disadvantaged and marginalised families.
Cost of inaction
Challenges in addressing air pollution
Lack of uniform regulatory frameworks on air pollution
“In Asia, regional integration will play a key role in addressing the challenge of air pollution. Pooling resources (technical and financial) and establishing a common and well-coordinated regional governance framework, will help to achieve the desired results in mitigating air pollution.”
Lack of data standardisation
Lack of compliance and clean authority
“Oftentimes, the institutions responsible for creating air pollution standards lack the powers to enforce these standards, which is a serious shortcoming.”
- Polash Mukerjee, Lead, Air Pollution and Climate Resilience, NRDC, India
Lack of financial resources


 Unchecked air pollution would mean
foggier skies and unbreathable air for present and future generations. This means
worsening health outcomes coupled with an increase in global temperature, melting
polar ice caps and a rise in mean sea levels. The practical implications of this
include an increase in food insecurity, increased occurrence of natural disasters
and economic instability, to name a few.
